
1. Assignment Objective
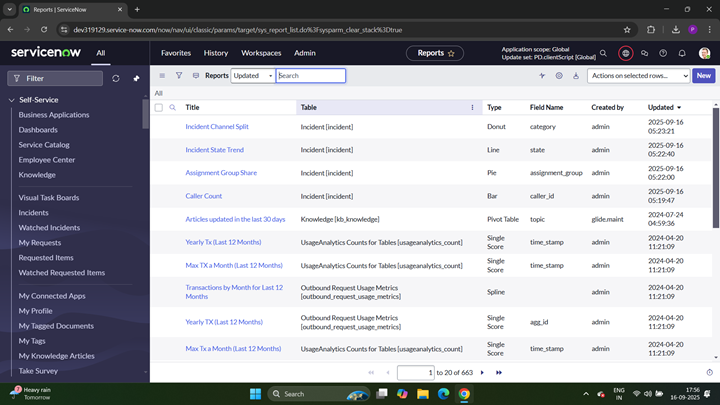
The objective of this assignment was to create four reports from the Incident table in ServiceNow using different chart types (bar, pie, line, donut), share them with a specific user (Afan Khan, user ID: ak), and then create a dashboard named ‘Incident Details’ to display all these reports together.
2. Importance of Reports in ServiceNow
Reports in ServiceNow are used to analyze and visualize data from different tables. They help ServiceNow administrators and support teams to monitor incidents, track performance, identify trends, and make data-driven decisions. Each report provides a specific view into the incident data.
3. Importance of Dashboards in ServiceNow
Dashboards in ServiceNow combine multiple reports into a single interface, making it easier to monitor different aspects of incident management in one place. They provide a quick and consolidated overview to support managers and decision-makers.
4. Implementation Steps with Screenshots
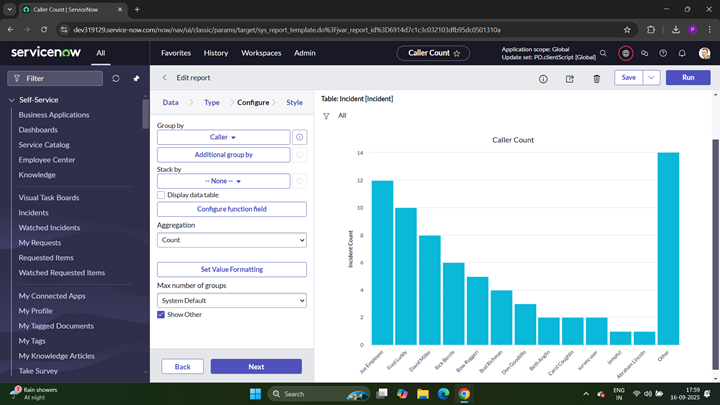
Caller Count Report (Bar Chart)
This report groups incidents by ‘Caller’ and displays the total number of incidents raised by each user in a bar chart. It helps to identify which users are raising the most incidents.
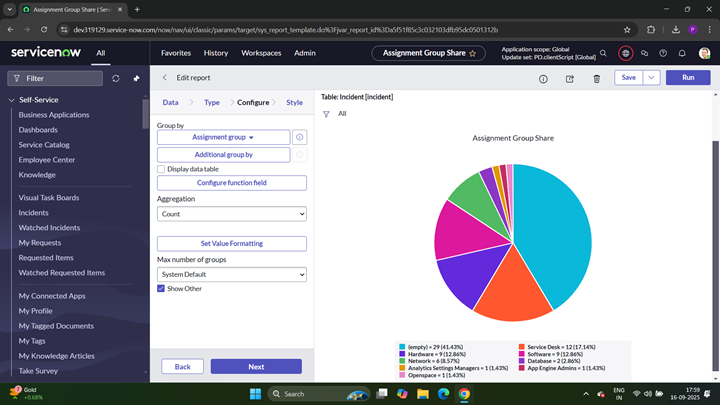
Assignment Group Share Report (Pie Chart)
This report groups incidents by ‘Assignment Group’ and shows the distribution of incidents among different support teams. It helps management see workload distribution.
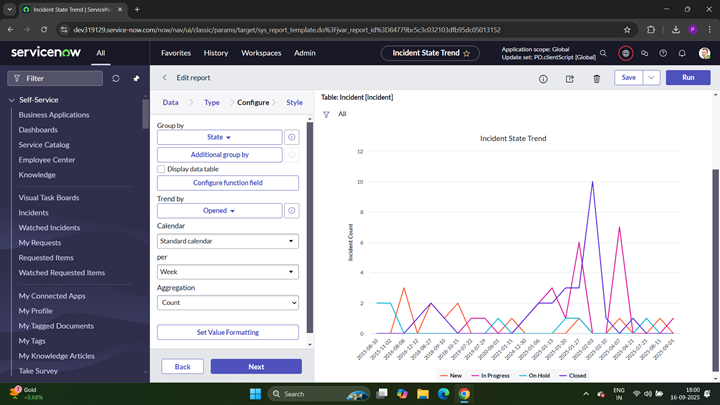
Incident State Trend Report (Line Chart)
This report groups incidents by ‘State’ and trends them by ‘Opened date’ per week. It helps track how incidents progress over time and gives visibility into workload trends.
Incident Channel Split Report (Donut Chart)
This report groups incidents by ‘Category’ and shows them in a donut chart. It helps to analyze which channels or categories are most frequently used to raise incidents.
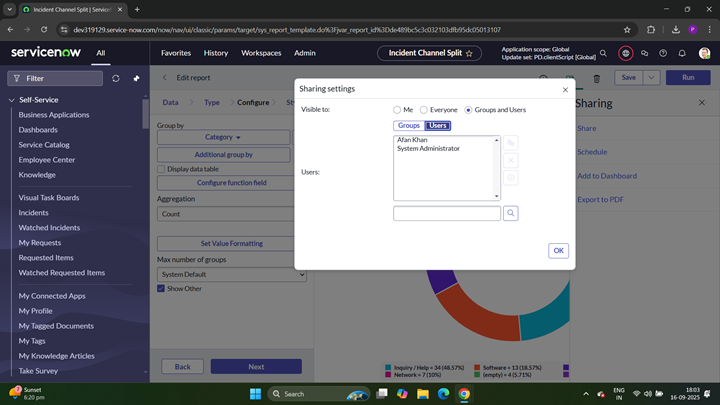
Sharing Reports with Afan Khan
After creating the reports, they were shared with a new user ‘Afan Khan’ (User ID: ak). This ensures that the user has access to view the reports. The screenshot below shows the sharing configuration.
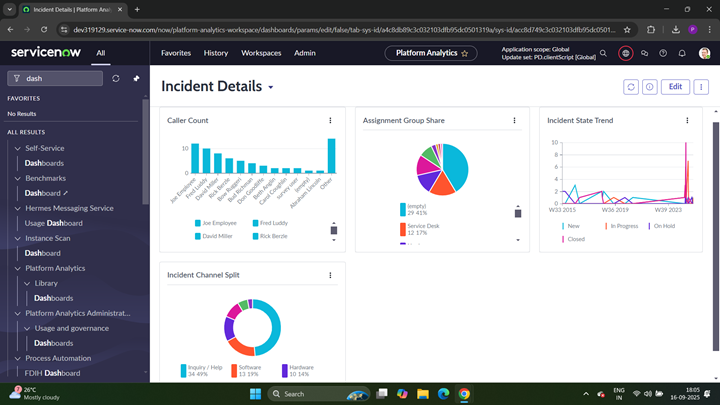
Incident Details Dashboard
Finally, a new dashboard named ‘Incident Details’ was created. All four reports were added to this dashboard and arranged neatly to give a consolidated view of incidents. This allows better monitoring and reporting from a single screen.
5. Conclusion
In conclusion, the assignment demonstrated how to create different types of reports in ServiceNow, share them with a user, and display them on a dashboard. Reports help analyze data, while dashboards provide a consolidated view for better decision-making. The user ‘Afan Khan’ was successfully given access to the reports, and all four reports were displayed together on the ‘Incident Details’ dashboard.
